
From “inevitable” cancellations to decisions based on real data
How a hotel group with 8 hotels in Madrid and Seville analyzed its reservation cancellations to reduce the impact on revenue and improve decision-making.
.png)
-100%
of the time spent on manual cancellation analysis
+4%
revenue recovered through cancellation management
100%
Visibility of cancellations by hotel and channel
Type of company
Hotel group:
8 hotels under management
Locations in Madrid and Seville
Main sales channels:
Own website
Other OTAs
Local teams in each hotel
Centralized management
Occupancy is good, but cancellations create constant uncertainty .
The Problem
Cancellations were treated as inevitable:
Booking displays aggregated data
Each hotel sees its share
Excel for making comparisons
Manual and delayed analysis
Common questions without clear answers:
Which hotels cancel the most and why?
What types of reservations are cancelled?
Does the channel, price, or advance notice make a difference?
When does it start to become a real problem?
“We know they cancel a lot, but we don’t know exactly where or why.”
The data exists.
But they are not structured to decide .
What was built
A web app for analyzing cancellations was developed, connected to the booking data of all hotels, with a clear objective: 👉 to make visible the real patterns behind the cancellations.
1. Centralized dashboard by hotel and city
The address can be viewed in one place:
Cancellation rate per hotel
Madrid vs Sevilla comparison
Temporal evolution
Actual impact on revenue
No exporting data hotel by hotel.
2. Analysis by reservation type
The system allows you to analyze cancellations by:
Channel (Booking, website, other)
Rate type
Advance booking
Length of stay
Average price
This allowed us to answer questions such as:
“Which fares generate the most cancellations?”
“Which reservations are being cancelled at the last minute?”
3. Pattern detection and alerts
Automatic alerts were configured to occur when:
A hotel surpasses its historical average
One type of reservation is starting to be cancelled more often
A future period shows high risk
Management only finds out when it's too late .
4. Operational view for revenue and management
Not everyone sees the same thing:
Direction: aggregate impact and trends
Revenue managers: actionable details
Local teams: only what's relevant to your hotel
Less noise.
More focus.
.png)
.png)
What was NOT built
The PMS was not replaced
Booking and the channels were not changed.
A complex BI was not created.
The teams were not asked to analyze Excel.
A clear analysis layer was created on top of existing data .
The Results
Operational impact
Real visibility of cancellations by hotel
Elimination of monthly manual analysis
Clear pattern identification
Early detection of problems
Impact on revenue and strategy
More informed cancellation policy adjustments
Better overbooking management
Risk-based tariff optimization
Fewer last-minute surprises
Why it worked:
A real problem was addressed, not an abstract KPI.
Dispersed information was centralized.
It was designed to make decisions, not to analyze for the sake of analyzing.
The way hotel teams work was respected.
There was no fight against the cancellations.
We learned from them .
Return on Investment
-100%
of the time spent on manual cancellation analysis
+4%
revenue recovered through cancellation management
100%
Visibility of cancellations by hotel and channel
.png)
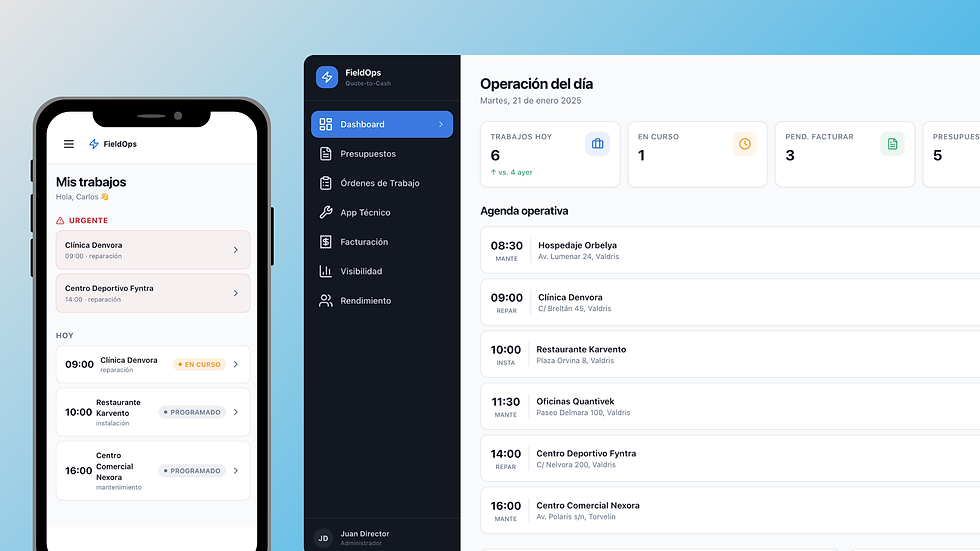
From wasting time on budgets, reports and invoices to controlling everything from your mobile phone.
How a maintenance company stopped wasting time on budgets, parts and invoices, and moved to control the entire work cycle from the mobile phone.

.png)
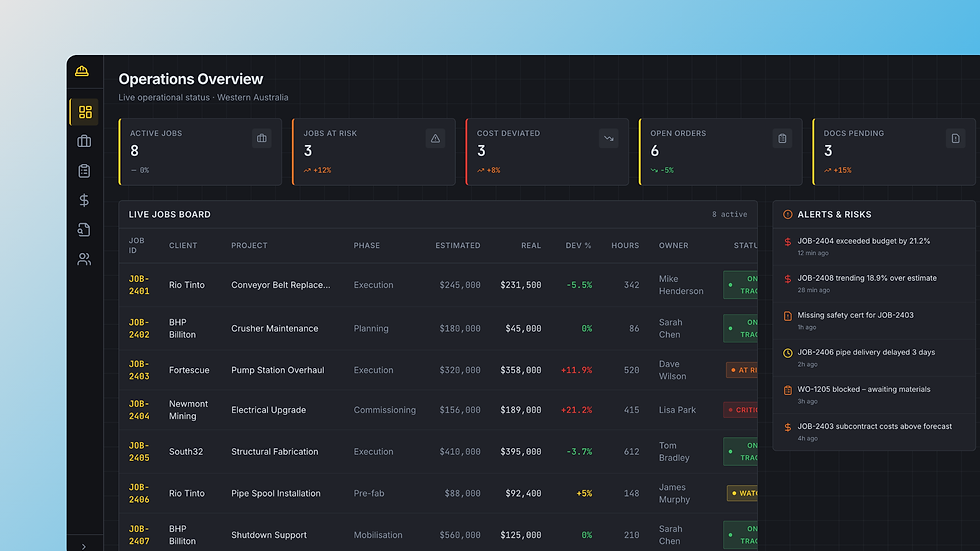
From losing control over costs and technical documentation to having 360º management.
How an industrial services company stopped losing control over costs, orders and technical documentation, and began operating with real visibility in every job.
.png)
From wasted weeks asking questions to having every new employee operational from day one
How a technical installation company accelerated the onboarding of new employees by centralizing processes, knowledge, and answers in an internal agent.